User-Centered Mobile Map Design of Fracking Infrastructure
This research project is conducted in collaboration with Dr. Jennifer Baka and Dr. John Kendall at Penn State. Their research focus is on understanding the political-industrial ecology of fracking infrastructure in western Pennsylvania. As a result, they needed to communicate this information to community members via two maps. I joined the project team to implement user-centered design to help determine how to develop two complimentary maps: a story map and an interactive map.
Political-industrial ecology is a framework which can create connections, and therefore greater understanding, between local community impacts and greater industrial processes. However, showing these relationships can be a difficult visualization challenge given that data takes place across multiple scales. Data visualization becomes even more complex when attempting to communicate information to public audiences, especially on mobile devices. However, mobile-first design is essential for community education, given that phones are the first place many users will encounter information.
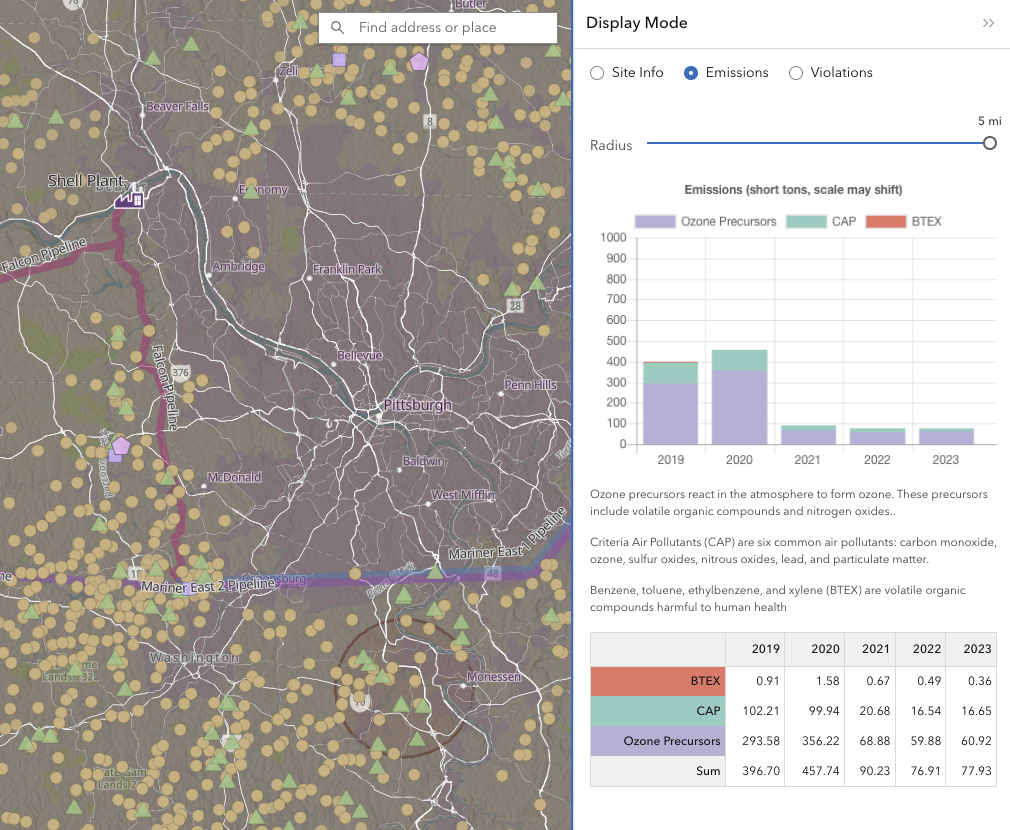
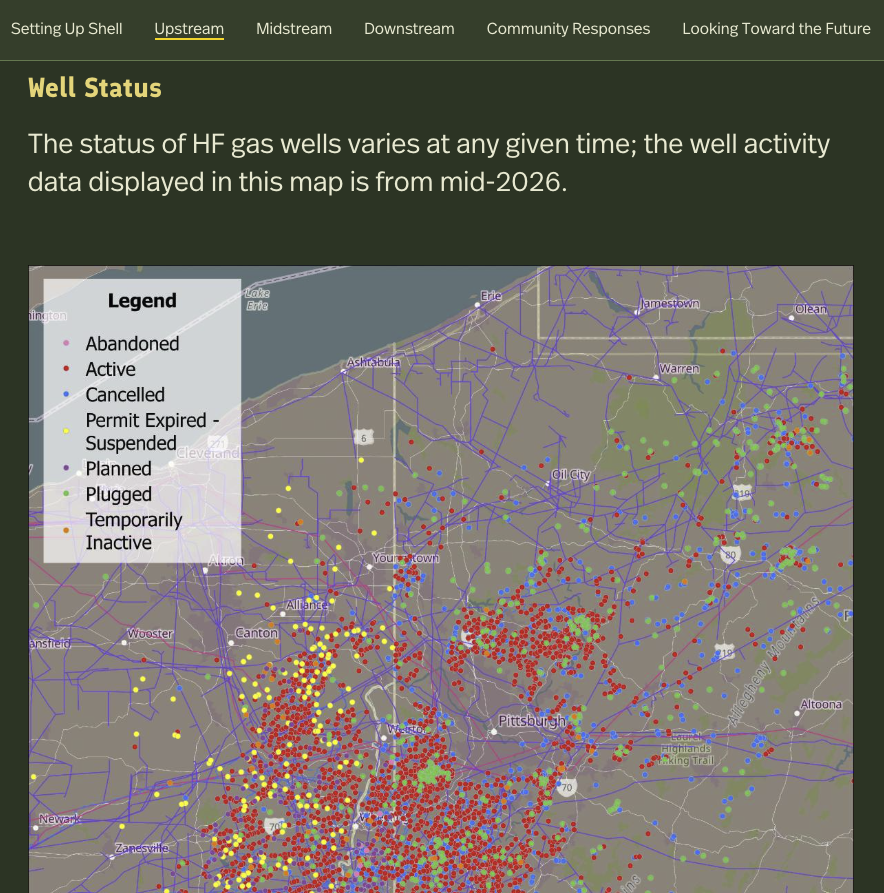
To tackle these issues, my project team combines the skills of researchers in political-industrial ecology with those of cartographic experts. Our case study is based in western Pennsylvania, with a specific focus on fracking and the Shell Plant, just north of Pittsburgh. We developed two mobile-first mapping tools (a linear story map and a searchable interactive map) to communicate the health and environmental impacts of the Shell Plant and the fracking industry to community members.
We employed user-centered design to test whether these mobile maps were effective for community members using open-ended and Likert-scale questions. We were interested in how well they could understand the complex concepts, how well these maps worked on mobile devices, and whether participants preferred to view the story map or interactive map first. Overall, participants found that the tools were readable and functioned well, while also providing suggestions to enhance the next versions. In particular, the Story Map frequently crashes on mobile iOS devices, and we are transitioning the story to Experience Builder.
I developed a custom vector basemap for the interactive map and developed prototypes and wireframes for this map, while a developer implemented the backend coding. I also developed all of the maps for the story map, while Jenn and John created the content. I led the user evaluations with help from John and graduate students.